Phase separation of RNF214 promotes the progression of hepatocellular carcinoma

Animal models of HCC
All animal procedures were approved by the Institutional Animal Care and Use Committee of Jinan University (approval number 20211116-02) and were in accordance with the NIH Guide for the Care and Use of Laboratory Animals. Four-week-old female BALB/c nude mice were randomly assigned to groups. The laboratory technician was unaware of the group allocation of the mice throughout the experiment. These mice were purchased from GemPharmatech (Nanjing, China). The given cells were injected into the mice in 100 μL of Dulbecco’s Modified Eagle Medium (DMEM) containing 2 × 10⁶ Cells, either under both shoulders or through the lateral tail vein (N = 5 mice). The tumor volume was calculated using the formula: 1/2 (length × width2). For ethical reasons, no animals were excluded from the analysis. The sample size for each group was determined based on previous studies (14). After anesthesia was administered to the mice, the weights of tumors and lungs were measured. Identification of cancerous tissue and normal tissue was performed using the hematoxylin and eosin staining method previously described in Ref. (14).
Human samples
Forty cases of primary HCC tissue and non-cancerous tissue were obtained from patients who underwent surgery at the First Affiliated Hospital of Jinan University. The experimental protocols for human subjects were approved by the Institutional Review Board (IRB) of Jinan University (approval number JNUKY-2022-092). Patients or their relatives provided signed informed consent.
Cell lines and reagents
The human embryonic kidney cell line HEK293T, the HCC cell lines SK-HEP-1, MHCC97H, MHCC97L, Huh7, Hep-3B, HepG2, PLC/PRF/5, SNU387 (from the Cell Bank of the Chinese Academy of Sciences), SNU449 (from the American Type Culture Collection), and the non-malignant liver cell line MIHA (from Dr. JR Chowdhury, Albert Einstein College of Medicine, NY, USA) were cultured in DMEM supplemented with 10% fetal bovine serum (purchased from Thermo Fisher Scientific, Waltham, MA, USA), 100 ng/ml streptomycin, and 100 U/ml penicillin at 37 °C with 5% CO2 in a humidified incubator. The cells were free of mycoplasma contamination.
The reagents and antibodies included in the study were as follows: PEG8000, sorbitol, NaCl, sucrose and other reagents were purchased from Sangon Biotech (Shanghai, China). Polyetherimide (PEI, #23966-1) was purchased from Polysciences (Warrington, PA, USA). Anti-RNF214 antibody (#202826-T38) was purchased from Sino Biological (Beijing, China). Anti-GFP antibody (#D110008-0200) and anti-GST antibody (#D190101-0200) were purchased from Sangon Biotech (Shanghai, China). Anti-β-actin antibody (#CL594-66009) was purchased from Proteintech (Wuhan, China). The anti-vinculin antibody (#A01207) was provided by BOSTER (Wuhan, China).
Plasmids and lentivirus infection
For protein expression in mammalian cells, plasmids were constructed using Gateway Cloning Technology using pDEST27, pCDH-Neo-Venus/DEST and pET-59-EGFP/DEST as destination vectors for the generation of the corresponding RNF214 constructs. The complete RNF214 protein consisting of 703 amino acid residues was used as a template (Gene ID: 257160). The resulting truncated constructs included segments spanning amino acids 1–206, 207–410, 411–657 and 658–703. In addition, constructs representing the complete N-terminal portion (1–410) and the C-terminal portion (411–703) were developed. In addition, a construct containing the CC domain (220–379) was created, as well as a construct with the CC domain deleted (∆CC), resulting in the deletion of 160 amino acids.
CRISPR/Cas9 technology was also used to construct stable cell lines. The two sgRNAs targeting human RNF214 (sgRNA1: 5′-cataaactagaagattccgg-3′, sgRNA2: 5′-tcagacgaaggtctcccaga-3′) were cloned into the LentiCRISPR V2 vector. RNF214 was cloned into pCDH-Neo-Venus/DEST vectors either in full-length or truncated form according to previously described methods (15). HEK293T cells were used to package the lentivirus, which was then collected from the medium supernatant. Cells were infected with the lentivirus to establish stable cell lines and then selected with puromycin or G418. Monoclonal cells were selected by limiting dilution and the knockout efficiency was verified by Western blotting and genome sequencing as previously mentioned (16).
Protein expression and purification
The full length and truncations of RNF214 were cloned into the pET-59-EGFP/DEST vector, which was created by inserting an EGFP element into the pET-59-DEST vector. Proteins in Escherichia coliBL21 (DE3) cells were induced by adding 0.1 mM isopropyl-β-D-thiogalactoside at 26 °C for 6 h. Cells were then lysed with a sonication solution containing 50 mM Tris-HCl (pH 7.5), 50 mM NaCl, 0.1 mg/ml lysozyme, 5% glycerol, and 1 mM phenylmethylsulfonyl fluoride. Sonication was then performed. After centrifugation, lysates were incubated with Ni-IDA Sepharose 6FF (Sangon Biotech, #C600029) at 4 °C for 4 h or overnight. The resin was washed four times with wash buffer (20 mM Tris-HCl, pH 8.0, 0.5 M NaCl, and 20 mM imidazole). The resin was then eluted with elution buffer (20 mM Tris-HCl, pH 8.0, 0.5 M NaCl, and 300 mM imidazole).
To confirm correct insertion of the target gene into the expression vector, total plasmid DNA was sequenced. The molecular weight of the purified protein was determined by SDS-PAGE followed by Coomassie staining and compared to a protein ladder to ensure that it matched the expected size. The identity of the recombinant protein was additionally confirmed by Western blot using antibodies specific to the GFP tag or the protein itself. After SDS-PAGE analysis, proteins were confirmed and aliquoted for storage at −80 °C.
GST pulldown test
HEK293T cells were transfected with 1 μg each of plasmids encoding GST fusion or Venus fusion proteins using PEI. After 48 hours of incubation at 37 °C in a CO2 In the incubator, cells were treated with trypsin to detach them, collected and lysed on ice. The lysate was clarified by centrifugation at 4°C and the supernatant was mixed with 50 μL of GST-tag purification resin (Beyotime, #P2251). The mixture was incubated overnight at 4°C with continuous rotation. After incubation, the supernatant was discarded and the resin was washed eight times with ice-cold cell lysis buffer to remove unbound proteins. The bound proteins were then eluted by adding 2× loading buffer, mixed and heated at 100°C for 10 min. The supernatant was collected and used for western blot to analyze the presence of the GST- or Venus-tagged proteins.
Fluorescence recovery after photobleaching
Purified proteins were prepared at a concentration of 1 μM and mixed with 10% PEG8000. Cells were then observed under the Zeiss LSM 900 confocal microscope (Oberkochen, Germany). Puncta were photobleached with a 488 nm laser at 100% power. After bleaching, images were taken once per second.
western spot
Proteins were isolated on 10–12% SDS–PAGE gels, loaded onto polyvinylidene fluoride membranes, blocked with 5% skim milk, and probed with the appropriate primary antibody followed by horseradish peroxidase-linked secondary antibody. After washing three times with TBST buffer (150 mM NaCl, 10 mM Tris-HCl, and 0.1% (v/v) Tween 20, pH 7.6), signals were examined using the ChemiDoc XRS chemiluminescence gel imaging system (Analytik Jena, Jena, Germany).
Cell proliferation test
Cell proliferation was examined by methylthiazolyltetrazolium (MTT) assay and colony formation assays. For the MTT assay, cells were cultured in 96-well plates for the indicated times. Then, 0.5 mg/ml MTT was added to each well. Formazan crystals were dissolved in 50 μL DMSO and absorbance was recorded at 570 nm after 4 hours of incubation. For the colony formation assay, cells were cultured in 12-well plates for 2 weeks, then fixed in 4% paraformaldehyde and stained with 0.1% crystal violet for 10 minutes. Colonies were photographed and counted under the microscope.
Cell migration test
Cell migration was demonstrated by wound healing and transwell assays. For the wound healing assay, cells were scratched at 90% confluence in 6-well plates with the tip of a 200 μL pipette and washed twice with PBS. After 24 hours, cells were allowed to migrate in serum-free culture medium and the appearance of wounds was monitored and documented. For the transwell assay, cells were seeded in the inserts containing serum-free culture medium. Each insert was then placed in the bottom chamber of 24-well plates containing culture medium containing 10% fetal bovine serum. After 24 hours of culture, cells on the top of the membrane were removed, while cells that had invaded the bottom were photographed. Cells were then immersed in 4% paraformaldehyde for 10 minutes for fixation and stained with 0.1% crystal violet for an additional 10 minutes.
Immunofluorescence test
Slides were used to culture cells, which were then treated with either or without NaCl. After removal of the medium, cells were fixed with 4% paraformaldehyde for 15 minutes and then washed three times with PBS for 5 minutes each. Cells were permeabilized with 0.3% Triton X-100 and then blocked with 5% BSA for 1 hour at room temperature. After that, cells were immersed in their primary antibody overnight at 4°C and washed three times with PBS. After addition of fluorescent secondary antibodies, cells were incubated in the dark for 1 hour and then washed three times with PBS. After incubation with 10 minutes of DAPI, slides were washed three times with PBS, sealed with an anti-fluorescence quencher, and images were captured using a confocal microscope (Zeiss LSM 900).
Immunohistochemical test
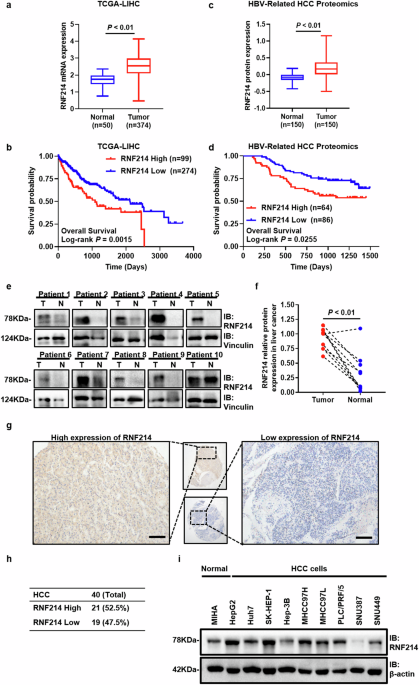
Tissue sections were deparaffinized with xylene and graded ethanol. For antigen retrieval, sections were boiled in 10 mM citrate buffer for 5 minutes. After cooling twice at room temperature, sections were incubated with 0.05% Triton X-100 for 15 minutes and then quenched with 3% H.2Ö2 for the same duration. A blocking step was performed with 3% BSA for 30 minutes. Subsequently, slides were washed with PBS and incubated with the primary antibody overnight at 4°C. After that, slides were immersed in secondary antibodies for 30 minutes and stained with DAB and hematoxylin. Protein expression was quantified as previously described (17). Briefly, immunohistochemistry scores were determined by multiplying the percentage of positive cells by the intensity score. Intensity was scored using the following scoring system: 0 for no staining, 1 for mild (pale yellow), 2 for moderate (yellowish brown), and 3 for strong (brown). An immunohistochemistry score of ≥50 was considered positive.
Statistical analysis
Statistics were described as mean ± standard deviation (SD). GraphPad Prism 8 and SPSS Statistics 24 were used for statistical analysis. The T-test and one-way ANOVA were used to compare two and multiple groups, respectively. Kaplan-Meier survival analysis was used to describe overall survival. Independent predictors of prognosis were investigated using Cox proportional hazard regression analysis. For categorical data, Fisher’s exact test or chi-square test was applied. The critical value for statistical significance was evaluated as follows: P< 0.05.


