
AdaptHealth Corp. (NASDAQ:AHCO) shares could be 41% below their estimated intrinsic value
 shares could be 41% below their estimated intrinsic value")
Key findings
-
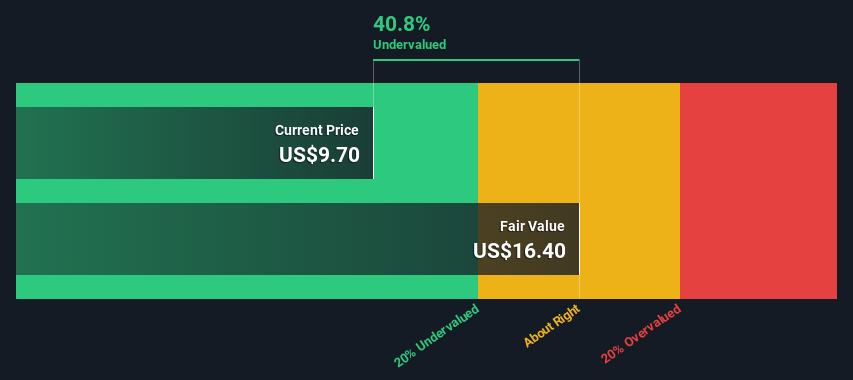
The projected fair value for AdaptHealth is $16.40 based on 2-step free cash flow to equity
-
AdaptHealth’s share price of $9.70 suggests the company may be undervalued by 41%
-
The analyst price target of $11.95 for AHCO is 27% below our fair value estimate
Today we’ll run through a valuation method that can be used to estimate the attractiveness of AdaptHealth Corp. (NASDAQ:AHCO) as an investment opportunity. To do this, we take the company’s projected future cash flows and discount them to today’s value. This is done using the Discounted Cash Flow (DCF) model. Before you think you can’t understand it, just keep reading! It’s actually a lot less complex than you think.
We would like to point out that there are many ways to value a company and that each method, such as the DCF, has advantages and disadvantages in certain scenarios. For those who like to engage in stock analysis, the analysis model presented here by Simply Wall St might be of interest.
Check out our latest analysis for AdaptHealth
Processing the numbers
We use the two-stage growth model, which simply means that we consider two stages of the company’s growth. In the early stage, the company might have a higher growth rate, and in the second stage, a stable growth rate is usually assumed. In the first stage, we need to estimate the company’s cash flows for the next ten years. Where possible, we use analyst estimates, but when these are not available, we extrapolate the previous free cash flow (FCF) from the last estimate or reported value. We assume that companies with shrinking free cash flow will slow their rate of shrinkage, and that companies with growing free cash flow will slow their growth rate, over this period. We do this to take into account that growth tends to slow down more in the early years than in later years.
A DCF is based on the idea that a dollar in the future is worth less than a dollar today. Therefore, the sum of these future cash flows is discounted to today’s value:
Estimation of free cash flow (FCF) over 10 years
|
2025 |
2026 |
2027 |
2028 |
2029 |
2030 |
2031 |
2032 |
2033 |
2034 |
|
|
Leveraged FCF (in million US dollars) |
149.8 million US dollars |
142.7 million US dollars |
138.9 million US dollars |
137.4 million US dollars |
137.3 million US dollars |
138.2 million US dollars |
139.8 million US dollars |
141.9 million US dollars |
144.5 million US dollars |
147.3 million US dollars |
|
Source of growth rate estimate |
Analyst x1 |
Estimated @ -4.77% |
Estimated @ -2.63% |
Estimated -1.12% |
Estimated -0.07% |
Estimated at 0.66% |
Estimated at 1.18% |
Estimated at 1.54% |
Estimated at 1.79% |
Estimated at 1.97% |
|
Present value (in million US dollars) discounted at 8.2% |
138 US dollars |
122 US dollars |
110 US dollars |
100 US dollars |
92.5 US dollars |
86.1 US dollars |
80.5 US dollars |
75.5 US dollars |
71.1 US dollars |
67.0 US dollars |
(“Est” = FCF growth rate, estimated by Simply Wall St)
Present value of 10-year cash flow (PVCF) = 943 million US dollars
After calculating the present value of future cash flows in the first 10-year period, we need to calculate the terminal value, which takes into account all future cash flows after the first period. For various reasons, a very conservative growth rate is used, which cannot exceed a country’s GDP growth. In this case, we used the 5-year average of the 10-year government bond yield (2.4%) to estimate future growth. In the same way as with the 10-year “growth” period, we discount future cash flows to today’s value, using a cost of equity of 8.2%.
Final value (TV)= FCF2034 × (1 + g) ÷ (r – g) = 147 million US dollars × (1 + 2.4%) ÷ (8.2% – 2.4%) = 2.6 billion US dollars
Present value of terminal value (PVTV)= TV / (1 + r)10= 2.6 billion US dollars ÷ (1 + 8.2%)10= 1.2 billion US dollars
The total value or equity value is then the sum of the present value of future cash flows, which in this case is $2.1 billion. The final step is to divide the equity value by the number of shares outstanding. Compared to the current share price of $9.7, the company appears quite undervalued at a 41% discount to the current share price. However, valuations are imprecise instruments, much like a telescope – move a few degrees and you end up in another galaxy. Keep this in mind.
The assumptions
The key inputs to a discounted cash flow are the discount rate and of course the actual cash flows. You don’t have to agree with these inputs, I recommend repeating the calculations yourself and playing around with them. The DCF also doesn’t take into account the potential cyclicality of an industry or a company’s future capital needs and therefore doesn’t provide a complete picture of a company’s potential performance. Since we are looking at AdaptHealth as potential shareholders, the cost of equity is used as the discount rate rather than the cost of capital (or weighted average cost of capital, WACC) which takes debt into account. In this calculation, we used 8.2%, which is based on a leveraged beta of 1.266. Beta is a measure of a stock’s volatility relative to the overall market. We get our beta from the industry average beta of globally comparable companies with an imposed limit of between 0.8 and 2.0, which is a reasonable range for a stable company.
SWOT Analysis for AdaptHealth
Strength
weakness
Opportunity
Danger
Next Steps:
While a company’s valuation is important, it is only one of many factors you need to evaluate a company. It is not possible to get a foolproof valuation using a DCF model. It should be viewed more as a guide to “what assumptions need to hold for this stock to be under/overvalued.” If a company grows at a different rate, or if its cost of equity or risk-free rate changes significantly, the outcome can look very different. Why is the intrinsic value higher than the current share price? For AdaptHealth, we have compiled three relevant factors for you to consider:
-
Financial health: Does AHCO have a healthy balance sheet? Take a look at our free balance sheet analysis with six simple checks for key factors such as leverage and risk.
-
Future income: How does AHCO’s growth rate compare to its competitors and the overall market? Learn more about analyst consensus numbers for the coming years by using our free chart of analyst growth expectations.
-
Other solid companies: Low debt, high returns on equity, and good past performance are the foundation of a strong company. Check out our interactive list of stocks with solid business fundamentals to see if there are any other companies you may not have considered!
PS The Simply Wall St app runs a discounted cash flow valuation for every stock on the NASDAQCM every day. If you want to find the calculation for other stocks, just search here.
Do you have feedback on this article? Are you concerned about the content? Get in touch directly from us. Alternatively, send an email to editorial-team (at) simplywallst.com.
This Simply Wall St article is of a general nature. We comment solely on historical data and analyst forecasts, using an unbiased methodology. Our articles do not constitute financial advice. It is not a recommendation to buy or sell any stock and does not take into account your objectives or financial situation. Our goal is to provide you with long-term analysis based on fundamental data. Note that our analysis may not take into account the latest price-sensitive company announcements or qualitative materials. Simply Wall St does not hold any of the stocks mentioned.
Do you have feedback on this article? Are you interested in the content? Contact us directly. Alternatively, send an email to [email protected]

In Dallas-Fort Worth, heat index values are expected to reach 105 for several days this week

Henry Cavill’s Man of Steel prevented a disaster behind the scenes during his co-star Chris Meloni’s weapons training

