
Calculating the intrinsic value of i3 Energy Plc (LON:I3E)
")
Key findings
-
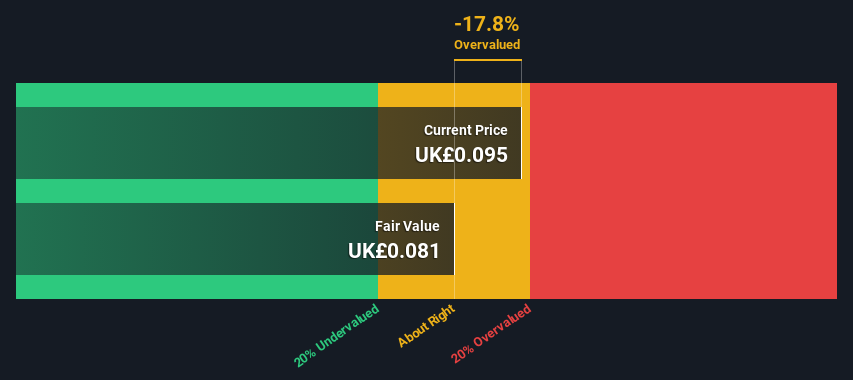
The forecast fair value for i3 Energy is 0.081 GBP based on the 2-step Free Cash Flow to Equity
-
The current share price of GBP 0.095 suggests that i3 Energy may be trading close to its fair value.
-
The analyst price target for I3E is GBP 0.27, which is 235% above our fair value estimate.
Today we’re going to go through one way to estimate the intrinsic value of i3 Energy Plc (LON:I3E) by estimating the company’s future cash flows and discounting them to their present value. This is done using the Discounted Cash Flow (DCF) model. Don’t be put off by the jargon, the math behind it is actually quite simple.
We would like to point out that there are many ways to value a company and that each method, such as the DCF, has advantages and disadvantages in certain scenarios. For those who like to engage in stock analysis, the analysis model presented here by Simply Wall St might be of interest.
Check out our latest analysis for i3 Energy
The calculation
We use the two-stage growth model, which simply means that we consider two stages of the company’s growth. In the early stage, the company might have a higher growth rate, and in the second stage, a stable growth rate is usually assumed. In the first stage, we need to estimate the company’s cash flows for the next ten years. Where possible, we use analyst estimates, but when these are not available, we extrapolate the previous free cash flow (FCF) from the last estimate or reported value. We assume that companies with shrinking free cash flow will slow their rate of shrinkage, and that companies with growing free cash flow will slow their growth rate, over this period. We do this to take into account that growth tends to slow down more in the early years than in later years.
A DCF is all about the idea that a dollar in the future is worth less than a dollar today. So we discount the value of these future cash flows to their estimated value in today’s dollars:
10-year free cash flow (FCF) forecast
|
2024 |
2025 |
2026 |
2027 |
2028 |
2029 |
2030 |
2031 |
2032 |
2033 |
|
|
Leveraged FCF (£, million) |
-8.83 million GBP |
£13.5 million |
£23.7 million |
£28.9 million |
£14.5 million |
£8.40 million |
£5.98 million |
£4.80 million |
£4.16 million |
£3.80 million |
|
Source of growth rate estimate |
Analyst x2 |
Analyst x2 |
Analyst x2 |
Analyst x2 |
Analyst x1 |
Estimated @ -42.04% |
Estimated @ -28.90% |
Estimated @ -19.70% |
Estimated @ -13.26% |
Estimated @ -8.75% |
|
Present value (£, million) discounted at 8.0% |
-8.2 GBP |
11,60 € |
18,80 € |
21.2 euros |
9,90 € |
5.3 euros |
3,5 € |
2.6 euros |
2.1 euros |
1.8 euros |
(“Est” = FCF growth rate, estimated by Simply Wall St)
Present value of 10-year cash flow (PVCF) = £68 million
The second period is also called the terminal value. This is the company’s cash flow after the first period. For various reasons, a very conservative growth rate is used, which cannot exceed a country’s GDP growth. In this case, we used the 5-year average of the 10-year Treasury bond yield (1.8%) to estimate future growth. In the same way as with the 10-year “growth” period, we discount future cash flows to today’s value, using a cost of equity of 8.0%.
Final value (TV)= FCF2033 × (1 + g) ÷ (r – g) = £3.8 million × (1 + 1.8%) ÷ (8.0% – 1.8%) = £62 million
Present value of terminal value (PVTV)= TV / (1 + r)10= £62 million ÷ (1 + 8.0%)10= £29 million
The total value or equity value is then the sum of the present value of future cash flows, which in this case is £97m. The final step is to divide the equity value by the number of shares in issue. Relative to the current share price of £0.1, the company is roughly at fair value at the time of writing. The assumptions in any calculation have a big impact on the valuation, so it’s better to think of this as a rough estimate that isn’t accurate to the last penny.
Important assumptions
The above calculation relies heavily on two assumptions. The first is the discount rate and the other is the cash flows. You don’t have to agree with these inputs, I recommend repeating the calculations yourself and playing with them. The DCF also doesn’t take into account the possible cyclicality of an industry or a company’s future capital needs and therefore doesn’t provide a complete picture of a company’s potential performance. Since we consider i3 Energy as potential shareholders, the cost of equity is used as the discount rate rather than the cost of capital (or weighted average cost of capital, WACC) which takes debt into account. In this calculation, we used 8.0% which is based on a leveraged beta of 1.142. Beta is a measure of a stock’s volatility relative to the overall market. We get our beta from the industry average beta of globally comparable companies with an imposed limit of between 0.8 and 2.0 which is a reasonable range for a stable company.
SWOT Analysis for i3 Energy
Strength
weakness
Opportunity
Danger
Looking ahead:
While a company’s valuation is important, it is only one of many factors you need to evaluate a company. It is not possible to get a foolproof valuation using a DCF model. It should be viewed more as a guide to “what assumptions need to hold for this stock to be under/overvalued.” For example, if the terminal value growth rate is adjusted slightly, it can dramatically change the overall result. For i3 Energy, we have compiled three other points you should evaluate:
-
Risks: For this purpose, you should consult the 1 warning sign we discovered it in the i3 Energy.
-
Future income: How is I3E’s growth rate compared to competitors and the overall market? Learn more about analyst consensus numbers for the coming years by using our free chart of analyst growth expectations.
-
Other solid companies: Low debt, high returns on equity, and good past performance are the foundation of a strong company. Check out our interactive list of stocks with solid business fundamentals to see if there are any other companies you may not have considered!
PS The Simply Wall St app does a discounted cash flow valuation for every stock on AIM every day. If you want to find the calculation for other stocks, just search here.
Do you have feedback on this article? Are you concerned about the content? Get in touch directly from us. Alternatively, send an email to editorial-team (at) simplywallst.com.
This Simply Wall St article is of a general nature. We comment solely on historical data and analyst forecasts, using an unbiased methodology. Our articles do not constitute financial advice. It is not a recommendation to buy or sell any stock and does not take into account your objectives or financial situation. Our goal is to provide you with long-term analysis based on fundamental data. Note that our analysis may not take into account the latest price-sensitive company announcements or qualitative materials. Simply Wall St does not hold any of the stocks mentioned.
Do you have feedback on this article? Are you interested in the content? Contact us directly. Alternatively, send an email to [email protected]

Michigan officials stress pet safety during July 4 celebrations

Utah Hockey Club signs Mikhail Sergachev from Tampa Bay

