
Estimate of the intrinsic value of Trican Well Service Ltd. (TSE:TCW)
")
Key findings
-
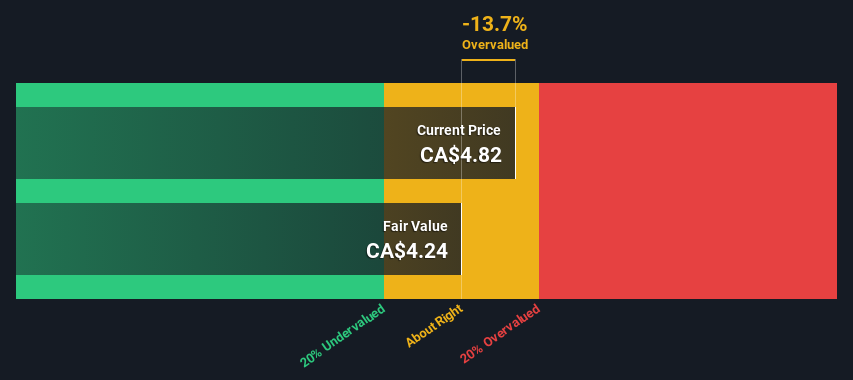
The estimated fair value of Trican Well Service is CA$4.24 based on the 2-step Free Cash Flow to Equity
-
With a share price of CA$4.82, Trican Well Service appears to be trading close to its estimated fair value
-
The analyst price target of CA$5.53 for TCW is 31% above our fair value estimate
How far is Trican Well Service Ltd. (TSE:TCW) from its intrinsic value? Using the most recent financial data, we will check if the stock is fairly valued by taking the expected future cash flows and discounting them to today’s value. To do this, we will use the Discounted Cash Flow (DCF) model. This may sound complicated, but it’s actually quite simple!
We generally believe that the value of a company is the present value of all the cash it will generate in the future. However, a DCF is just one valuation metric among many, and it is not without its flaws. If you want to learn more about discounted cash flow, you can read the basics of this calculation in detail in Simply Wall St’s analysis model.
Check out our latest analysis for Trican Well Service
Processing the numbers
We use a two-stage DCF model which, as the name suggests, considers two phases of growth. The first stage is generally a higher growth phase that stabilizes toward the terminal value captured in the second “steady growth” stage. First, we need to estimate the next ten years of cash flows. Where possible, we use analyst estimates, but when these aren’t available, we extrapolate previous free cash flow (FCF) from the last estimate or reported value. We assume that companies with shrinking free cash flow will slow their rate of shrinkage, and that companies with growing free cash flow will slow their growth rate over this period. We do this to take into account that growth tends to slow more in the early years than in later years.
A DCF is all about the idea that a dollar in the future is worth less than a dollar today. So we discount the value of these future cash flows to their estimated value in today’s dollars:
10-year free cash flow (FCF) forecast
|
2024 |
2025 |
2026 |
2027 |
2028 |
2029 |
2030 |
2031 |
2032 |
2033 |
|
|
Leveraged FCF (CA$, million) |
CA$89.0 million |
CA$124.2 million |
CA$108.6 million |
CA$66.0 million |
CA$67.0 million |
CA$56.4 million |
CA$50.6 million |
CA$47.2 million |
CA$45.3 million |
CA$44.3 million |
|
Source of growth rate estimate |
Analyst x4 |
Analyst x4 |
Analyst x2 |
Analyst x1 |
Analyst x1 |
Estimated @ -15.76% |
Estimated @ -10.41% |
Estimated @ -6.66% |
Estimated @ -4.04% |
Estimated @ -2.20% |
|
Present value (in million CA$) discounted at 8.0% |
82.4 CA$ |
CA$106 |
86.2 CA$ |
48.5 CA$ |
45.6 CA$ |
35.6 CA$ |
29.5 CA$ |
25.5 CA$ |
22.6 CA$ |
20.5 CA$ |
(“Est” = FCF growth rate, estimated by Simply Wall St)
Present value of 10-year cash flow (PVCF) = CA$503 million
The second period is also called the terminal value. This is the company’s cash flow after the first period. For various reasons, a very conservative growth rate is used, which cannot exceed a country’s GDP growth. In this case, we used the 5-year average of the 10-year Treasury bond yield (2.1%) to estimate future growth. In the same way as with the 10-year “growth” period, we discount future cash flows to today’s value, using a cost of equity of 8.0%.
Final value (TV)= FCF2033 × (1 + g) ÷ (r – g) = CA$44 million × (1 + 2.1%) ÷ (8.0% – 2.1%) = CA$763 million
Present value of terminal value (PVTV)= TV / (1 + r)10= CA$763 million ÷ ( 1 + 8.0 %)10= CA$353 million
The total value or equity value is then the sum of the present value of future cash flows, which in this case is CA$856 million. The final step is to divide the equity value by the number of shares outstanding. Compared to the current share price of CA$4.8, the company appears to be around fair value at the time of writing. However, keep in mind that this is only an approximate valuation and as with any complex formula, where there’s garbage in, there’s garbage out.
Important assumptions
The key inputs to a discounted cash flow are the discount rate and of course the actual cash flows. If you don’t agree with these results, try the calculation yourself and play with the assumptions. DCF also doesn’t take into account the possible cyclicality of an industry or a company’s future capital needs and therefore doesn’t provide a complete picture of a company’s potential performance. Since we consider Trican Well Service as potential shareholders, the cost of equity is used as the discount rate rather than the cost of capital (or weighted average cost of capital, WACC) which takes debt into account. In this calculation, we used 8.0%, which is based on a leveraged beta of 1.288. Beta is a measure of a stock’s volatility relative to the overall market. We get our beta from the industry average beta of globally comparable companies, with a set limit between 0.8 and 2.0, which is a reasonable range for a stable company.
SWOT Analysis for Trican Well Service
Strength
weakness
Opportunity
Danger
Next Steps:
Valuation is only one side of the coin when building your investment thesis and ideally should not be the only analysis you look at for a company. It is not possible to get a foolproof valuation using a DCF model. It would be better if you apply different cases and assumptions and see how they would affect the company’s valuation. For example, changes in the company’s cost of equity or risk-free interest rate can significantly affect the valuation. For Trican Well Service, we have compiled three additional aspects for you to consider:
-
Risks: For example, we discovered 2 warning signs for Trican Well Service (1 is concerning!) that you should know before investing here.
-
Future income: How does TCW’s growth rate compare to its competitors and the overall market? Learn more about analyst consensus numbers for the coming years by using our free chart of analyst growth expectations.
-
Other high-quality alternatives: Like a good all-rounder? Explore our interactive list of high-quality stocks to get a sense of what else you might be missing out on!
PS The Simply Wall St app runs a discounted cash flow valuation for every stock on the TSX every day. If you want to find the calculation for other stocks, just search here.
Do you have feedback on this article? Are you concerned about the content? Get in touch directly from us. Alternatively, send an email to editorial-team (at) simplywallst.com.
This Simply Wall St article is of a general nature. We comment solely on historical data and analyst forecasts, using an unbiased methodology. Our articles do not constitute financial advice. It is not a recommendation to buy or sell any stock and does not take into account your objectives or financial situation. Our goal is to provide you with long-term analysis based on fundamental data. Note that our analysis may not take into account the latest price-sensitive company announcements or qualitative materials. Simply Wall St does not hold any of the stocks mentioned.
Do you have feedback on this article? Are you interested in the content? Contact us directly. Alternatively, send an email to [email protected]

Insights into Kym Marsh’s love life before her new boyfriend Samuel Thomas

The thrill of the kiln drives ceramicists Nancy Train Smith and Chris Gustin

