
Fair value estimate of A2 Milk Company Limited (NZSE: ATM)
")
Does The a2 Milk Company Limited (NZSE:ATM) share price in March reflect its actual value? Today we will estimate the intrinsic value of the stock by taking the expected future cash flows and discounting them to today’s value. This is done using the Discounted Cash Flow (DCF) model. This may sound complicated, but it’s actually quite simple!
Companies can be valued in many ways, so we would like to point out that a DCF is not perfect for every situation. If you want to learn more about intrinsic value, you should take a look at Simply Wall St’s analysis model.
Check out our latest analysis for a2 milk
The method
We use what is called a 2-stage model, which simply means that we have two different growth periods for the company’s cash flows. Generally speaking, the first stage is one of higher growth, and the second stage is one of lower growth. First, we need to get estimates for the next ten years of cash flows. Where possible, we use analyst estimates, but when these aren’t available, we extrapolate the previous free cash flow (FCF) from the last estimate or reported value. We assume that companies with shrinking free cash flow will slow their rate of shrinkage, and that companies with growing free cash flow will slow their growth rate, over this period. We do this to take into account that growth tends to slow more in the early years than in later years.
In general, we assume that a dollar today is worth more than a dollar in the future. Therefore, we need to discount the sum of these future cash flows to arrive at an estimate of present value:
Estimation of free cash flow (FCF) over 10 years
|
2020 |
2021 |
2022 |
2023 |
2024 |
2025 |
2026 |
2027 |
2028 |
2029 |
|
|
Leveraged FCF (NZ$, million) |
NZ$330.3 million |
NZ$393.8 million |
NZ$518.2 million |
NZ$608.0 million |
NZ$657.0 million |
NZ$692.3 million |
NZ$721.1 million |
NZ$744.9 million |
NZ$765.1 million |
NZ$782.7 million |
|
Source of growth rate estimate |
Analyst x4 |
Analyst x4 |
Analyst x3 |
Analyst x1 |
Analyst x1 |
Estimated at 5.37% |
Estimated at 4.16% |
Estimated at 3.31% |
Estimated at 2.71% |
Estimated at 2.29% |
|
Present value (NZ$, million) discounted at 5.7% |
NZ$313 |
NZ$353 |
NZ$439 |
NZ$488 |
NZ$499 |
NZ$497 |
NZ$490 |
NZ$479 |
NZ$466 |
NZ$451 |
(“Est” = FCF growth rate, estimated by Simply Wall St)
Present value of 10-year cash flow (PVCF) = NZ$4.5 billion
The second period is also called the terminal value. This is the company’s cash flow after the first period. For various reasons, a very conservative growth rate is used, which cannot exceed a country’s GDP growth. In this case, we used the 10-year government bond rate (1.3%) to estimate future growth. In the same way as with the 10-year “growth” period, we discount future cash flows to today’s value, using a cost of equity of 5.7%.
Final value (TV)= FCF2029 × (1 + g) ÷ (r – g) = NZ$783 million × (1 + 1.3%) ÷ 5.7% – 1.3%) = NZ$18 billion
Present value of terminal value (PVTV)= TV / (1 + r)10= NZ$18 billion ÷ ( 1 + 5.7 %)10= NZ$10 billion
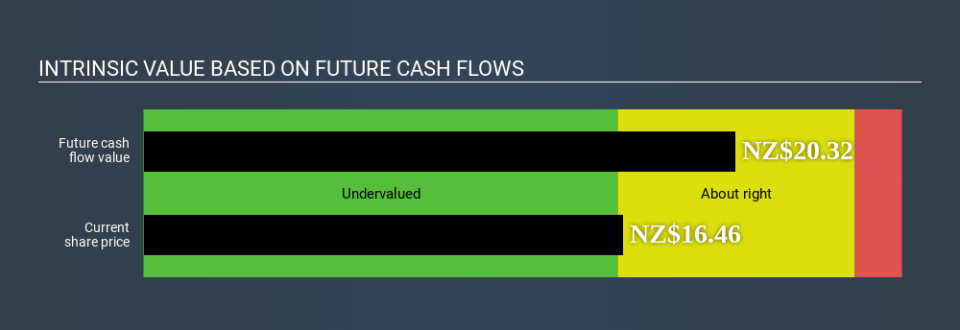
The total value or equity value is then the sum of the present value of future cash flows, which in this case is NZ$15 billion. In the final step, we divide the equity value by the number of shares outstanding. Relative to the current share price of NZ$16.5, the company appears roughly fairly valued at a 19% discount to the current share price. However, keep in mind that this is only an approximate valuation and as with any complex formula, where there’s garbage in, there’s garbage out.
Important assumptions
The above calculation relies heavily on two assumptions. The first is the discount rate and the other is the cash flows. If you disagree with these results, try the calculation yourself and play with the assumptions. DCF also does not take into account the possible cyclicality of an industry or a company’s future capital needs and therefore does not provide a complete picture of a company’s potential performance. Since we consider a2 Milk as potential shareholders, the cost of equity is used as the discount rate rather than the cost of capital (or weighted average cost of capital, WACC) which takes debt into account. In this calculation, we used 5.7% which is based on a leveraged beta of 0.800. Beta is a measure of a stock’s volatility relative to the overall market. We get our beta from the industry average beta of globally comparable companies with an imposed limit of between 0.8 and 2.0, which is a reasonable range for a stable company.
Next Steps:
Valuation is only one side of the coin when it comes to developing your investment thesis, and it shouldn’t be the only metric you consider when researching a company. The DCF model is not a perfect stock valuation tool. It should be viewed more as a guide to “what assumptions need to hold for this stock to be under/overvalued.” If a company grows at a different rate, or if its cost of equity or risk-free rate changes significantly, the outcome may look very different. For a2 Milk, there are three other aspects you should investigate further:
-
Financial health: Does ATM have a healthy balance sheet? Take a look at our free balance sheet analysis with six simple checks on key factors such as debt and risk.
-
management:Have insiders increased their shares to capitalize on market sentiment regarding ATM’s future prospects? Read our management and board analysis with insights into CEO compensation and governance factors.
-
Other solid companies: Low debt, high returns on equity, and good past performance are the foundation of a strong company. Check out our interactive list of stocks with solid business fundamentals to see if there are any other companies you may not have considered!
PS Simply Wall St updates its DCF calculation for each New Zealand stock daily, so if you want to find out the intrinsic value of another stock, just search here.
If you spot an error that needs to be corrected, please contact the editor at [email protected]. This Simply Wall St article is general in nature. It is not a recommendation to buy or sell any stock and does not take into account your objectives or financial situation. Simply Wall St has no ownership interest in any stocks mentioned.
Our goal is to provide you with long-term research analysis based on fundamental data. Note that our analysis may not take into account the latest price-sensitive company announcements or qualitative materials. Thanks for reading.

Protesters in Barcelona spray visitors with water: Why is tourism no longer so popular in Europe?

Cobalt Strike takedown should make Sliver more popular

